Furukawa Electric Group Medium-term 2022~2025
(2025 Mid-term Plan)

Road to Vision 2030 Transform and Challenge

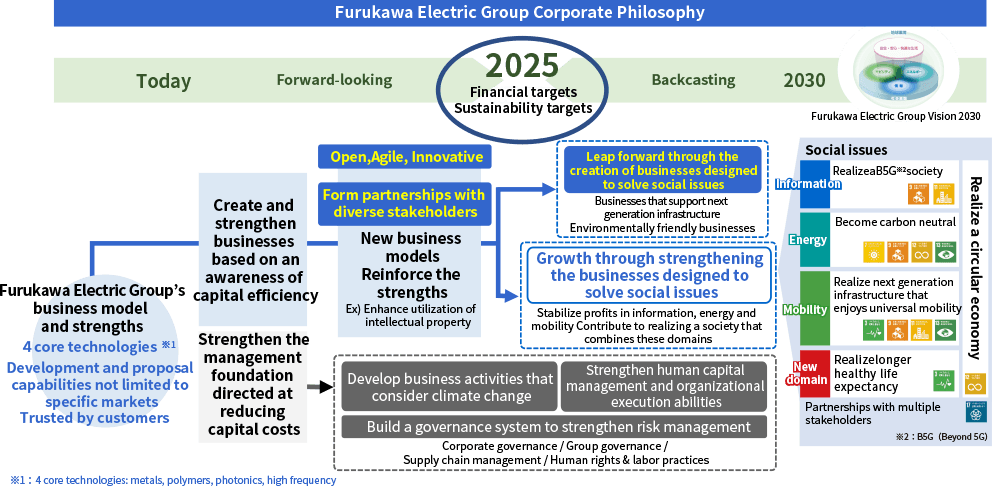
Vision 2030 and positioning of 2025 Mid-term Plan

Value creation process directed at achieving Vision 2030

  • Formulated 25 Mid-Term Plan as a milestone for achieving Vision 2030, which embodies what we will at 2030
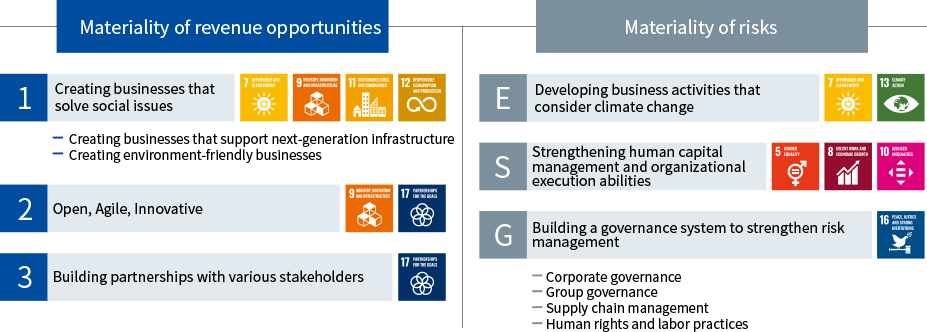
  • Identifying materiality as an important management issue from the perspective of profit opportunities and risks
  • Promotion of ESG management with the aim of sustainable growth and medium-to long-term improvement of corporate value


Positioning of 2025 Mid-term Plan

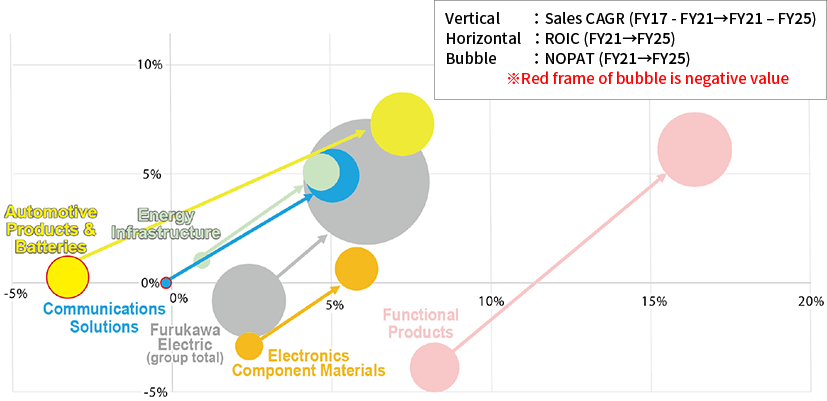
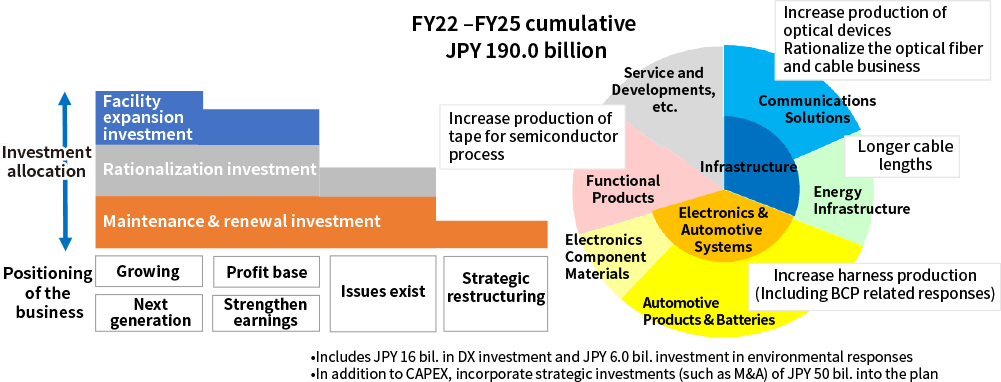
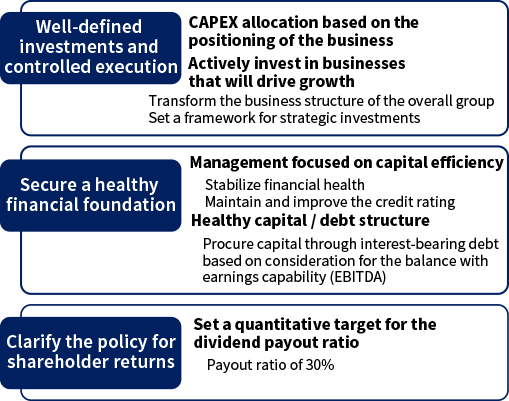
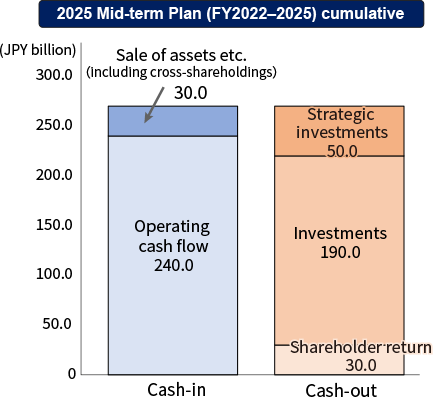
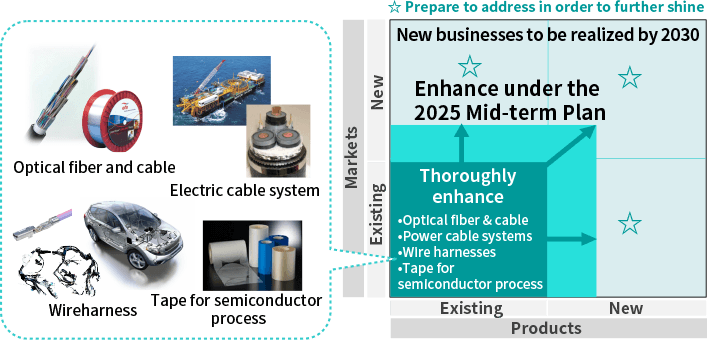
  • Maximize profits in existing businesses through a focus on capital efficiency directed at 2025
  • Build a foundation for creating new businesses by 2030


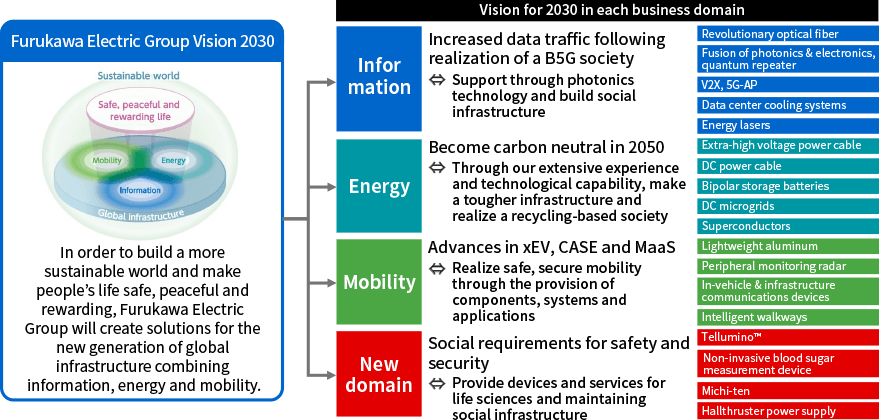
Vision 2030 (Each business domain)

  • Create new value with customers as partners
  • Solve social issues through that Furukawa Electric Group’s technology, products and services will "support" and "be utilized"

Numerical management targets and allocation of management resources

Financial goals

  • Achieved business growth, improved profitability and capital efficiency (ROIC, ROE)
FY2021 result FY2022 forecast FY2025 target
ROIC (after tax) 2.5% 3% More than 6%
ROE 3.7% 5% More than 11%
NetD/E ratio 1.0 1.0 Less than 0.8
Capital ratio 29.8% 30% More than 35%
Sales JPY 930.5 billion JPY 1,050.0 billion More than
JPY 1,100.0 billion
Operating income JPY 11.4 billion JPY 22.5 billion More than
JPY 58.0 billion
Net income attributable to
owners of the parent
JPY 10.1 billion JPY 14.0 billion More than
JPY 37.0 billion
Average copper price (JPY/Kg) 1,136 1,260 1,085
Average exchange rate (JPY/dollar) 112 120 110


2025 Mid-term plan target (net sales, operating income) by segment

(JPY billion)
FY2021 result FY2022 forecast FY2025 target
Sales Operating
income
Ratio Sales Operating
income
Ratio Sales Operating
income
Ratio
Infrastructure 297.0 5.2 1.7% 330.0 6.5 2.0% 360.0 16.0 4.4%

Communications Solutions

191.3 3.8 2.0% 215.0 5.0 2.3% 230.0 11.5 5.0%

Energy Infrastructure

105.7 1.4 1.3% 115.0 1.5 1.3% 130.0 4.5 3.5%
Electronics &
Automotive Systems
500.7 0.1 0.0% 575.0 10.0 1.7% 590.0 23.5 4.0%

Automotive Products
& Batteries

249.9 ▲4.6 ▲1.9% 295.0 6.0 2.0% 330 16.5 5.0%

Electronics Component
Materials

250.8 4.8 1.9% 280.0 4.0 1.4% 260.0 7.0 2.7%
Functional Products 130.0 7.6 5.8% 155.0 8.5 5.5% 165.0 19.5 11.8%
Service and Developments, etc. 34.5 ▲1.4 ▲4.0% 30.0 ▲2.5 ▲8.3% 40.0 ▲1.0 ▲2.5%
Total 930.5 11.4 1.2% 1,050.0 22.5 2.1% 1,115.0 58.0 5.2%

Note about net sales in the Electronics Component Materials sub-segment within the Electronics & Automotive Systems segment

  • FY25 net sales were calculated assuming copper price of JPY 1,085/kg (reason for lower net sales compared to FY22)
  • If calculated using the copper price forecast level in FY22 (JPY 1,260/kg), net sales would be JPY 285.0 billion (higher than FY22)


Business portfolio optimization and allocation of management resources

  • Furukawa Electric Group's target for FY2025: ROIC more than 6%

Furukawa Electric (group total) and each sub-segment (FY21 actual ➡ FY25 target)


Business portfolio optimization and allocation of management resources (CAPEX / strategic investment)

  • Based on the positioning of the business, implement controlled execution of well-defined investments
  • Secured investments in DX and environmental responses from a companywide perspective


Capital and cash allocation policy

  • Through investment in growth domains and securing a financial foundation for achieving growth, aim to sustainably increase corporate value
  • Stable and ongoing shareholder returns as a basic policy and will issue a performance linked dividend based on a payout ratio of about 30% of consolidated net income attributable to owners of the parent company

Strengthen the foundation for ESG management

Strengthen the corporate functions that support business growth

  • Set the priority “materiality” directed at achieving Vision 2030
  • Set “sustainability indicators and targets” to be achieved during the 2025 Mid-term plan


Sustainability Indicators

  • By achieving the sustainability indicators that contribute to resolving the materiality, aim to achieve Vision 2030.
Materiality   FY2021
result
FY2022
target
FY2025
target
Revenue Opportunities 1 Create businesses that solve social issues Sales ratio of environmentally friendly products (Consolidated)

Consolidated

62% 64% 70%
2 Open, Agile, Innovative
Build partnerships with various stakeholders
R&D expense growth rate for new businesses (compared to FY21)

Consolidated

(100%) 115% 125%
3 Implementation rate of IP landscaping for strengthening the businesses and themes for creating new businesses

Consolidated

17% 30% 100%
Risks E Develop business activities that consider climate change GHG emissions reduction rate (Scope1,2) (compared to FY17)

Consolidated

▲29.0% ▲17.7% ▲28.3%
Ratio of renewable energy use to total consumption

Consolidated

10.9% 11.5% 13%
S Strengthen human capital management and organizational execution abilities Employee engagement scores

Non-
consolidated

Start measuring FY2023
Set targets
Ratio of female managers

Non-
consolidated

3.8% 4.5% 7%
Ratio of career track hiring among total new staff hiring

Non-
consolidated

37% 30% 30%
G Build a governance system to strengthen risk management Ratio of SAQ implementation based on the CSR Procurement Guidelines for major suppliers

Consolidated

Non-
consolidated
20%
Global
20%
100%
Ratio of follow-up on risk management activities for all risk domains

Consolidated

88% 93% 100%
Implementation rate of human rights training for managerial positions

Consolidated

Start in Japan 100%